What's Inside Your Report?
Inside your report, you’ll find:

Nationwide picture of salaries for similar employees

Localized recommendations for salaried pastors

Comparison of factors such as education and experience

Demographic analysis of benefits for similar employees

Cost of living comparison

Salary ranges for comparable jobs outside the church

Understand the Salary Report
Learn more about the sections within each salary report and how to apply them to your staff.
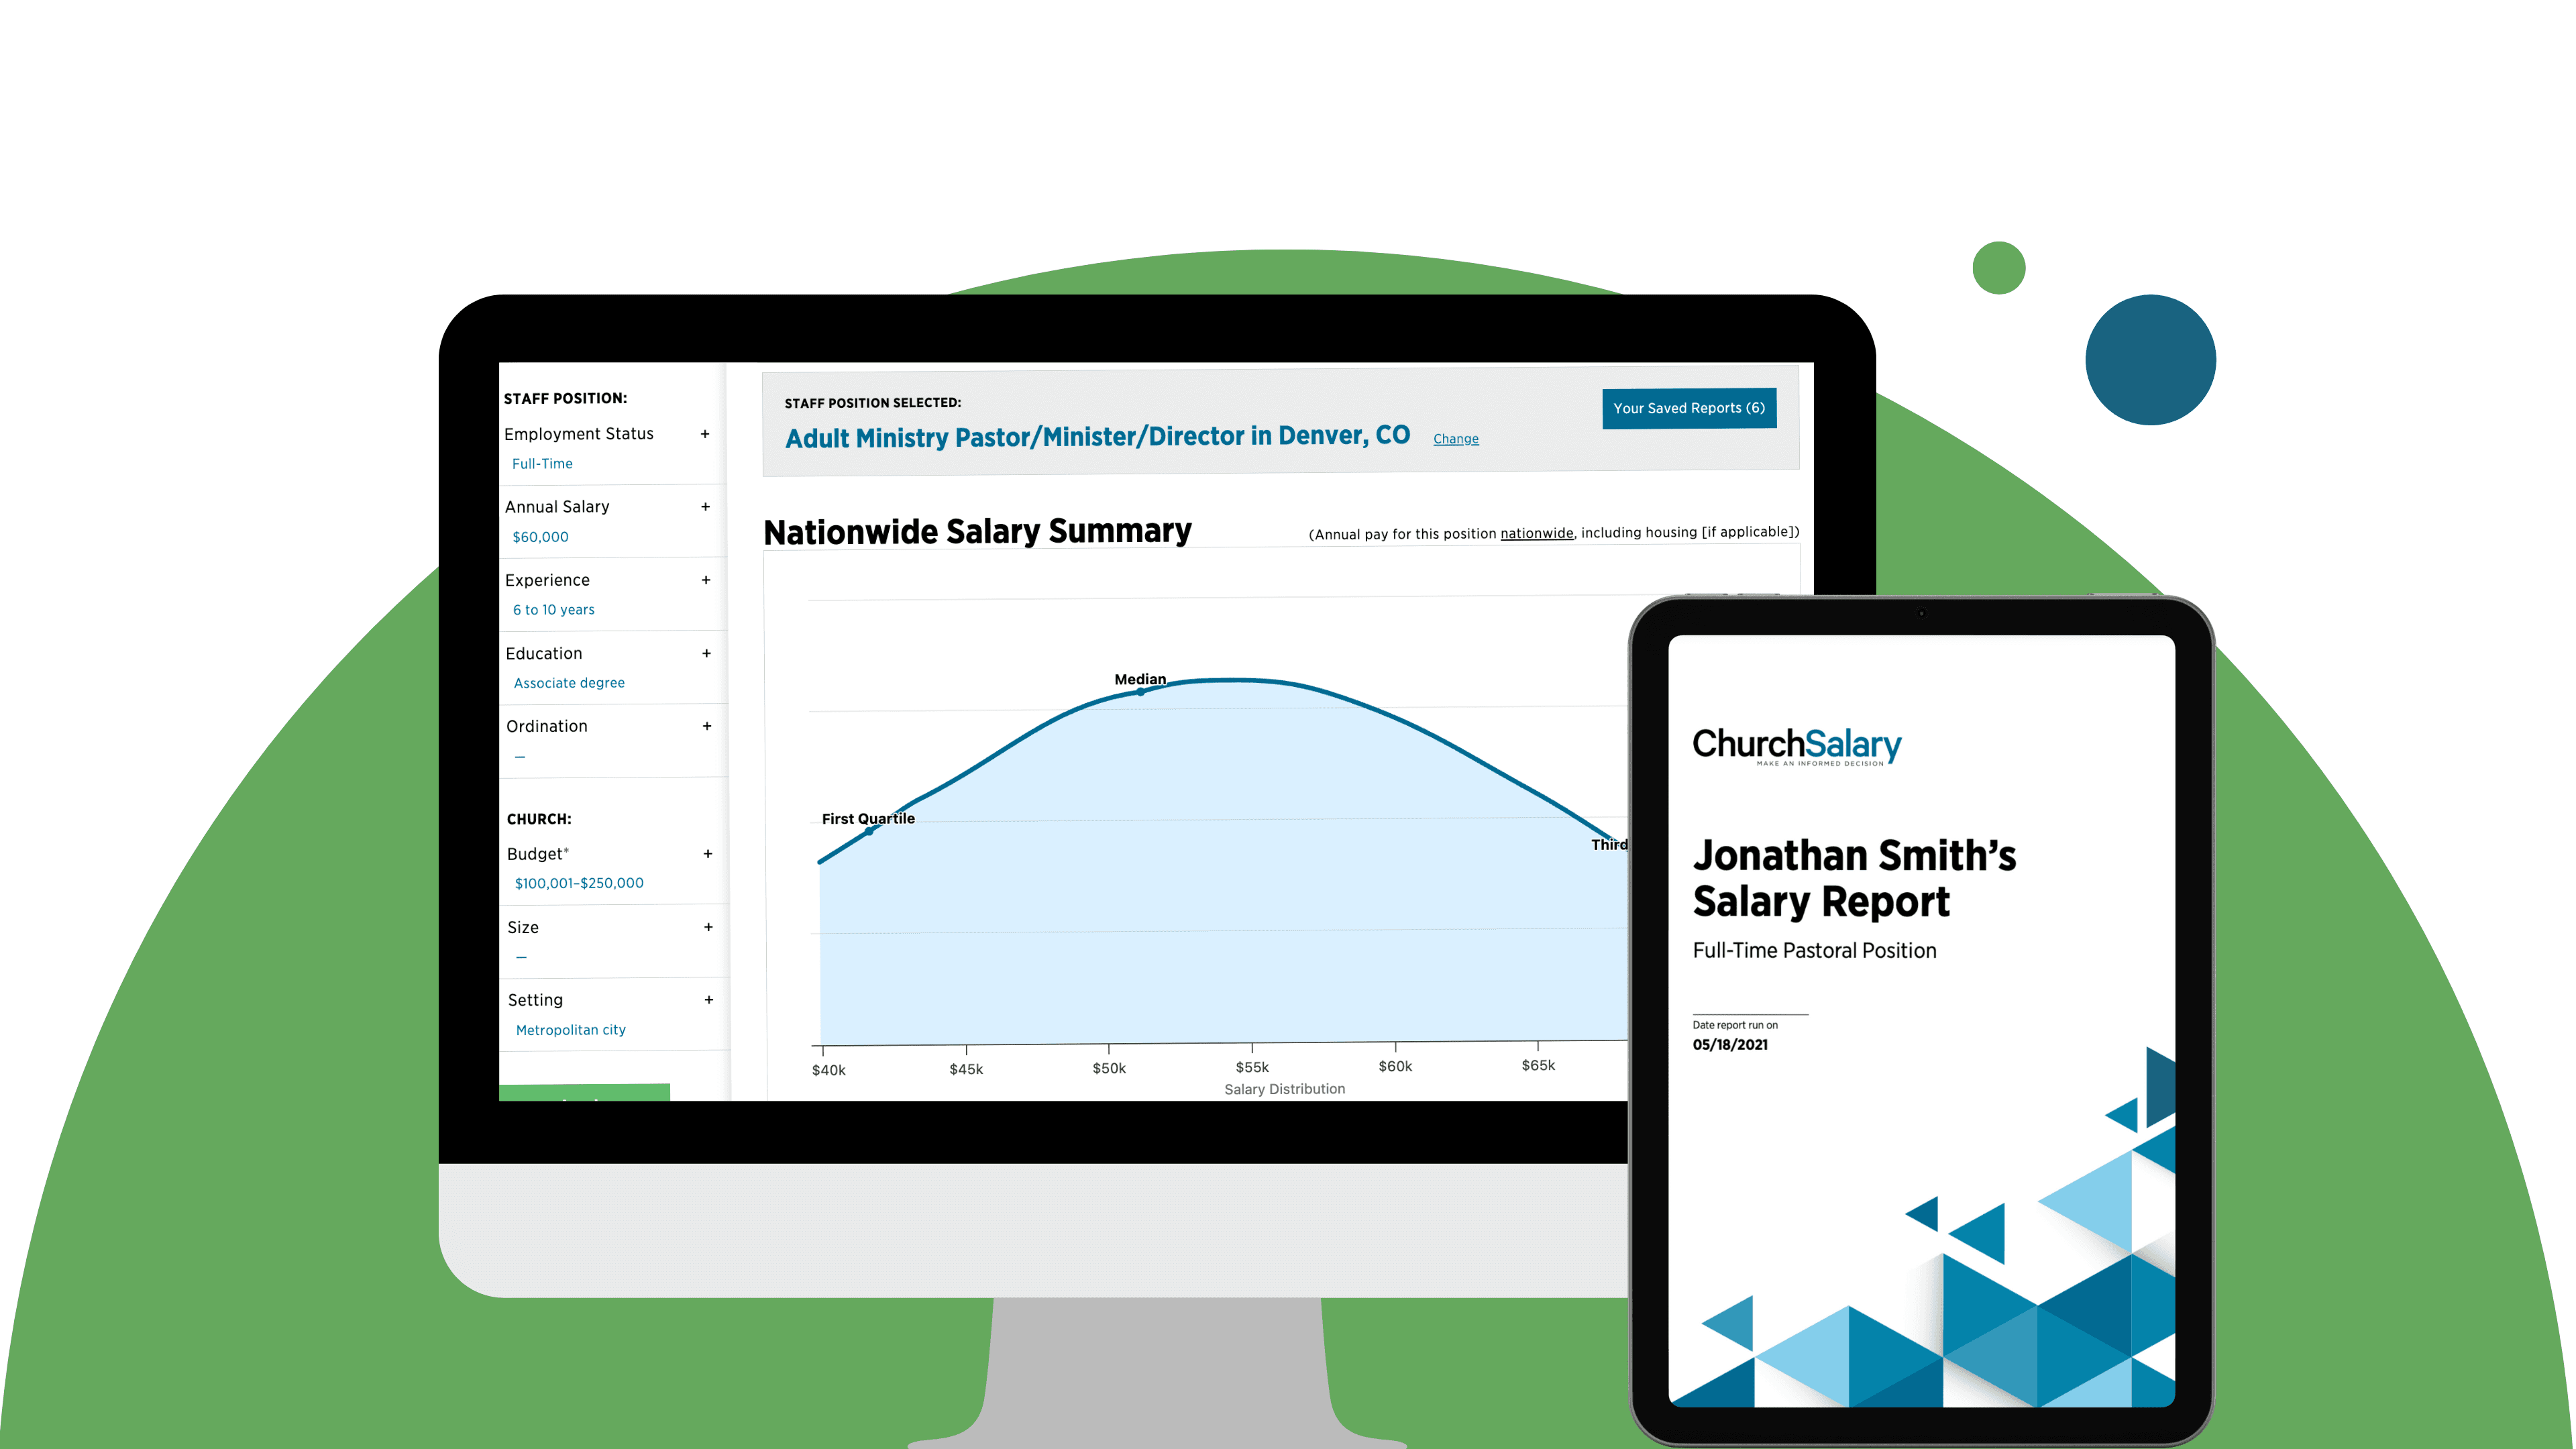
Your report from ChurchSalary contains several sections. The first one features this blue chart. What are you seeing? And what do all these numbers mean?
So, you have a Salary Report, and a lot of numbers. But how do you use them?
What should we pay pastors at our church? It’s tempting to ask around. But, this isn’t actually the best way to localize salary.
Every employee is different. How do you attach a dollar amount to those differences?
What does the average pastor look like demographically? And, how do the staff members at your church stack up against their peers?
Learn about the two most eye-opening numbers in every ChurchSalary report: The cost of living index and median household income.
Ready to Create Your Report?
Get Started
Ready to Create Your Report?
Get Started

Understand the Salary Report
Learn more about the sections within each salary report and how to apply them to your staff.
Your report from ChurchSalary contains several sections. The first one features this blue chart. What are you seeing? And what do all these numbers mean?
So, you have a Salary Report, and a lot of numbers. But how do you use them?
What should we pay pastors at our church? It’s tempting to ask around. But, this isn’t actually the best way to localize salary.
Every employee is different. How do you attach a dollar amount to those differences?
What does the average pastor look like demographically? And, how do the staff members at your church stack up against their peers?
Learn about the two most eye-opening numbers in every ChurchSalary report: The cost of living index and median household income.
Inside your report, you’ll find:
Nationwide picture of salaries for similar employees
Localized recommendations for salaried pastors
Comparison of factors such as education and experience
Demographic analysis of benefits for similar employees
Cost of living comparison
Salary ranges for comparable jobs outside the church
Create Reports
Preview Sample Report →
What's Inside Your Report?